Store Analytics
The panel includes a comprehensive analytics system that provides real-time insights into your store’s performance, customer behavior, and sales trends. This system helps you make data-driven decisions to optimize your store operations and grow your business.
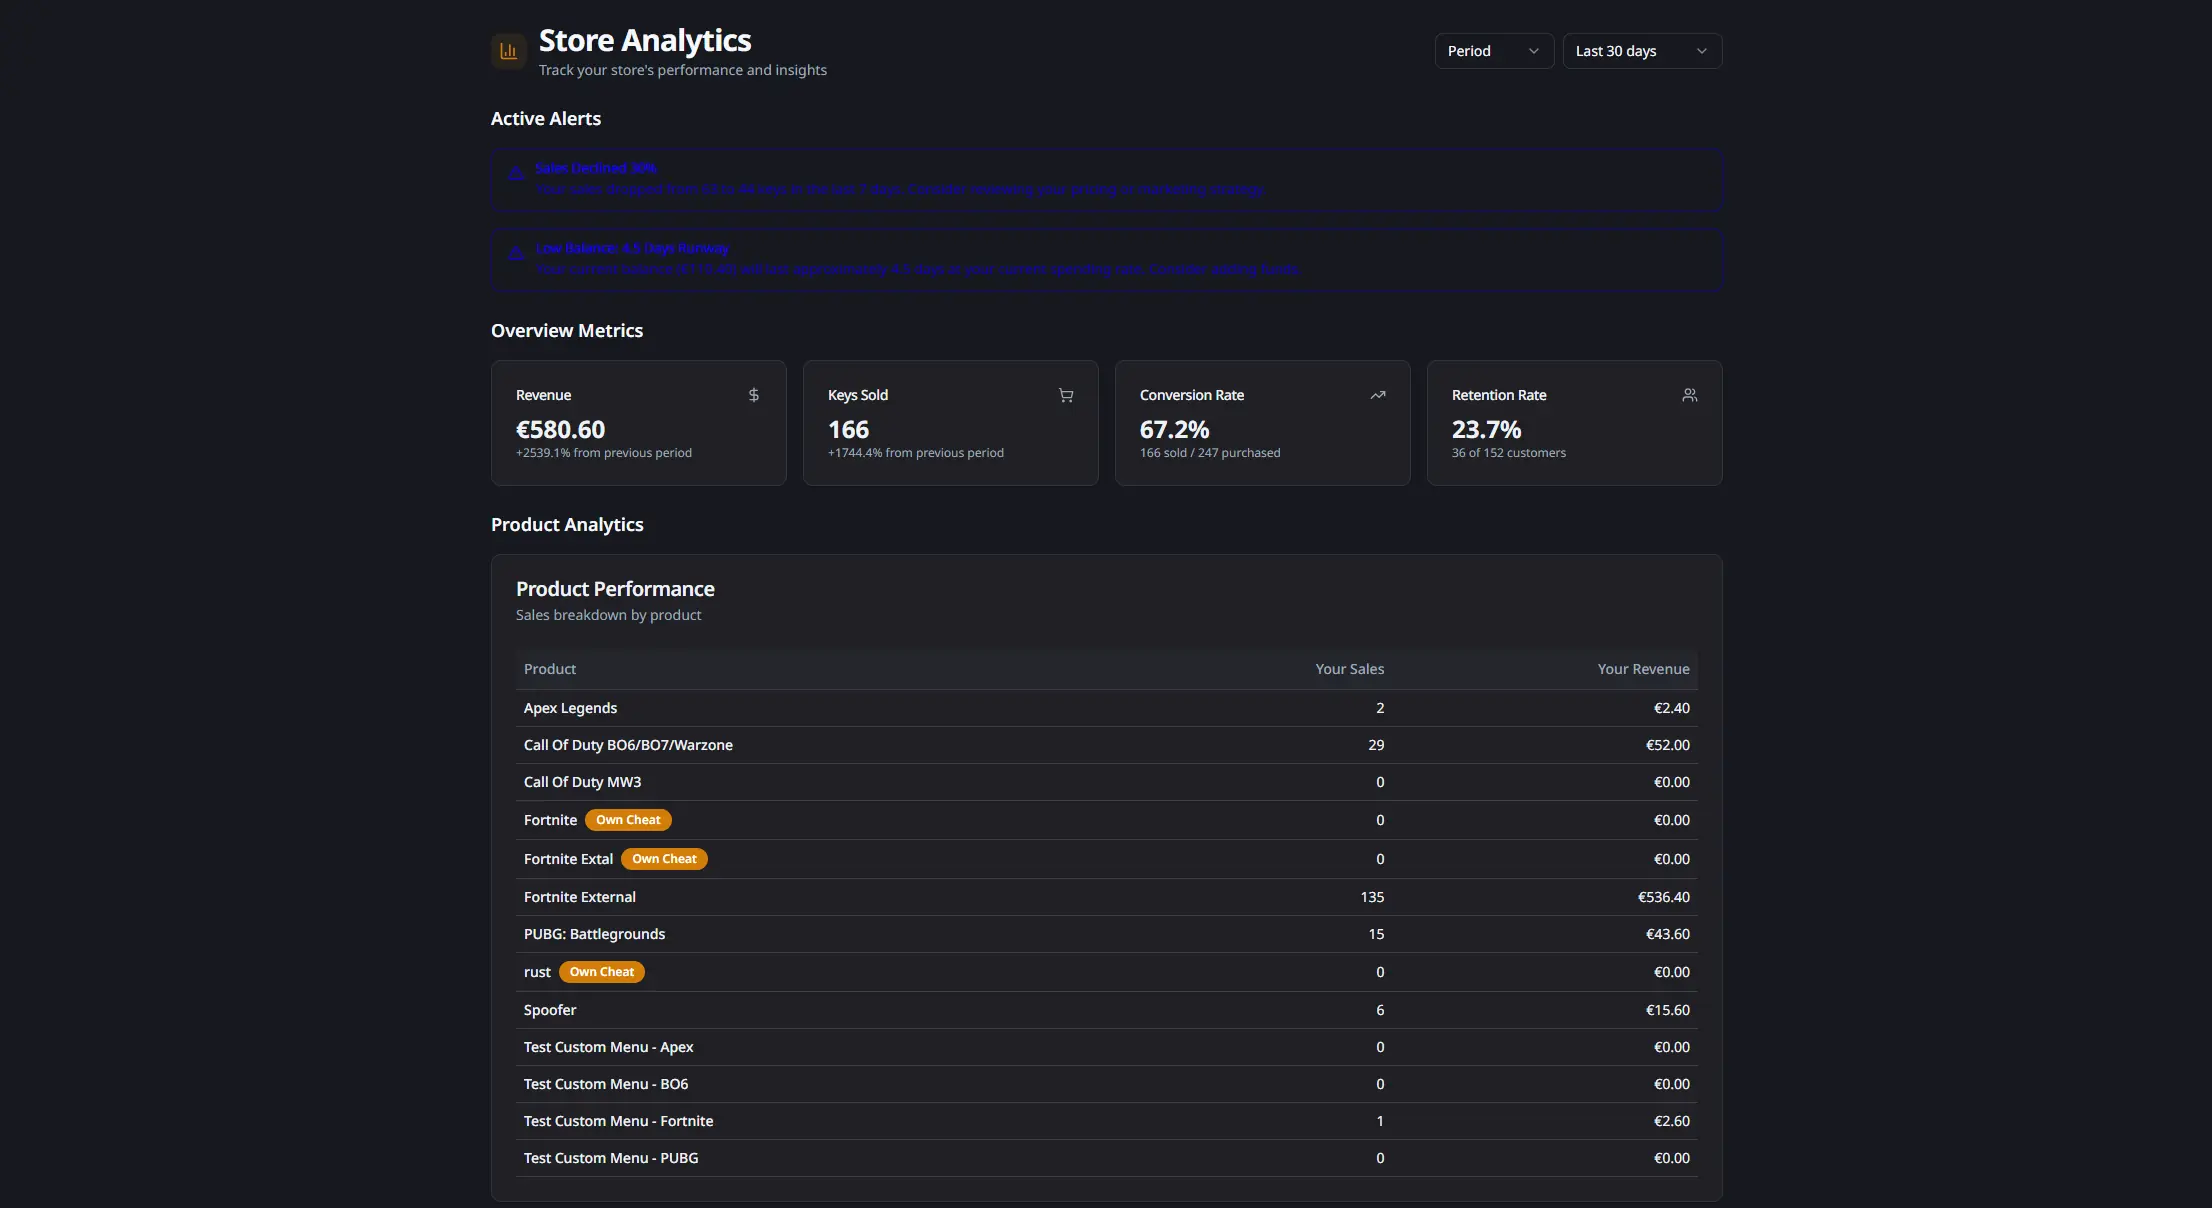
Overview Metrics
The analytics dashboard provides key performance indicators at a glance:
- Revenue: total revenue generated in the selected period with growth percentage compared to the previous period
- Keys Sold: total number of keys sold with growth tracking
- Conversion Rate: percentage of purchased keys that were sold (keys sold / keys purchased)
- Retention Rate: percentage of customers who made repeat purchases (recurring customers / total customers)
All metrics update in real-time and can be filtered by period, specific date, or month.
Product Analytics
The product analytics section shows detailed performance metrics for each cheat in your catalog:
- Individual Product Performance: revenue and keys sold per product
- Product Filtering: click any product to filter all analytics for that specific product
- Own Cheat Badge: products you developed yourself are marked with an “Own Cheat” badge
- Customer Breakdown: view new and recurring customer counts per product
You can filter analytics by selecting a specific product, which updates all charts and metrics to show data only for that product.
Customer Analytics
The customer analytics section provides insights into your customer base:
- Customer Acquisition: pie chart showing the distribution of new vs recurring customers
- Customer Trend: line chart showing daily new and recurring customer counts over time
- Total Customers: combined count of new and returning customers
- Balance Activity: breakdown of balance added vs balance spent during the period
- Active Keys: average number of active keys across the period
You can filter analytics by customer type (new or recurring) by clicking on the corresponding segment in the pie chart.
Customer Insights
Advanced customer insights help you understand customer behavior and identify opportunities:
- Purchase Frequency: average and median days between purchases for recurring customers
- Churn Rate: percentage of customers who stopped purchasing, with risk customer identification
- Renewal Rate: percentage of expired keys that were renewed, with average days to renewal
- Active Customers: count and percentage of customers with active keys
- Top Customers: table showing your highest-value customers by total spent, activations, and last purchase date
These insights help you identify at-risk customers, understand renewal patterns, and focus on your most valuable customers.
Sales Trends & Forecasts
The trends section provides predictive analytics and seasonality insights:
- Growth Rate: percentage change in sales compared to the previous period, with trend indicators (growing, stable, declining) and velocity metrics
- Sales Forecast: predicted sales for the next 7 days with confidence levels (low, medium, high)
- Peak Activity: identifies the best day of the week and peak hour for sales
- Sales Trend Chart: line chart showing daily sales with a 7-day moving average to identify patterns
- Seasonality Analysis: bar charts showing sales distribution by day of week and hour of day
These forecasts help you plan inventory, marketing campaigns, and staffing based on predicted demand patterns.
Complementary Products
The complementary products section identifies products that are frequently purchased together:
- Product Pairs: shows which products customers buy together most often
- Co-occurrences: number of times products were purchased together
- Confidence Score: percentage indicating the strength of the product pairing
This information helps you create product bundles, cross-sell opportunities, and understand customer preferences.
Automatic Alerts
The system automatically generates alerts for important events:
- Performance Drops: significant decreases in sales or revenue
- Low Stock: when key inventory is running low
- Low Balance: when your account balance needs attention
- Churn Risk: when customer retention metrics indicate potential issues
- Growth Opportunities: suggestions for improving performance
Alerts are color-coded by severity (info, warning, critical) and appear at the top of the analytics page.
Advanced Filtering
The analytics system includes comprehensive filtering options:
- Period Filter: select predefined periods (last 7, 30, or 90 days)
- Date Filter: analyze performance for a specific date
- Month Filter: view analytics for a specific month
- Product Filter: focus on a single product’s performance
- Customer Type Filter: analyze only new or recurring customers
Filters can be combined to create custom views. Active filters are displayed as badges that can be removed with a single click.
Use Cases
Performance Monitoring: track revenue, sales, and growth metrics to monitor store health.
Product Optimization: identify top-performing products and optimize underperforming ones.
Customer Retention: use churn and renewal insights to improve customer retention strategies.
Inventory Planning: use forecasts and trends to plan key purchases and manage stock levels.
Marketing Strategy: leverage seasonality data to time promotions and marketing campaigns.
Cross-selling: use complementary product data to create bundles and increase average order value.